
Performance metrics of Nexus Gateway
The Nexus Gateway performance metrics provide you with real-time visibility of your Nexus Gateway's and the efficiency of your configured Nexus Gateway(s).
These metrics help you monitor system resource usage, request handling capacity, and analyze downtime trends, ensuring that the Nexus Gateway can reliably act as a secure communication bridge between your internal infrastructure and the Site24x7 cloud platform.
To access the added Nexus Gateway:
-
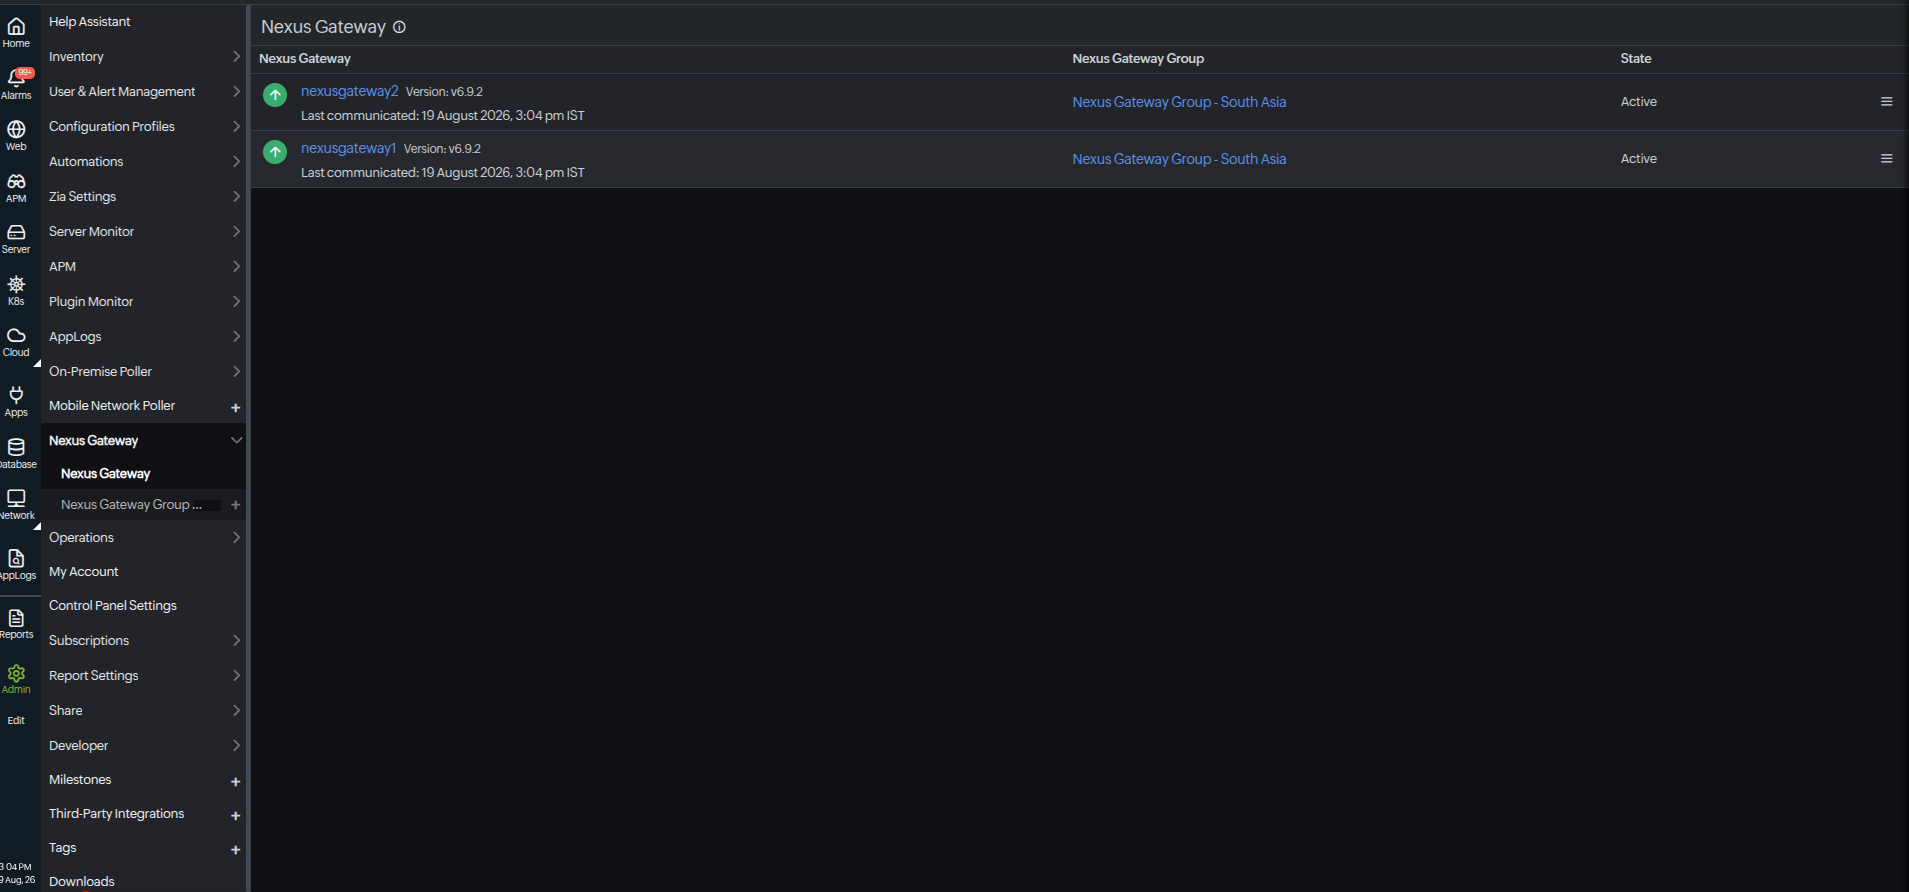
Navigate to Admin > Nexus Gateway > Nexus Gateway.
-
Click the added Nexus Gateway's name to view the metrics.
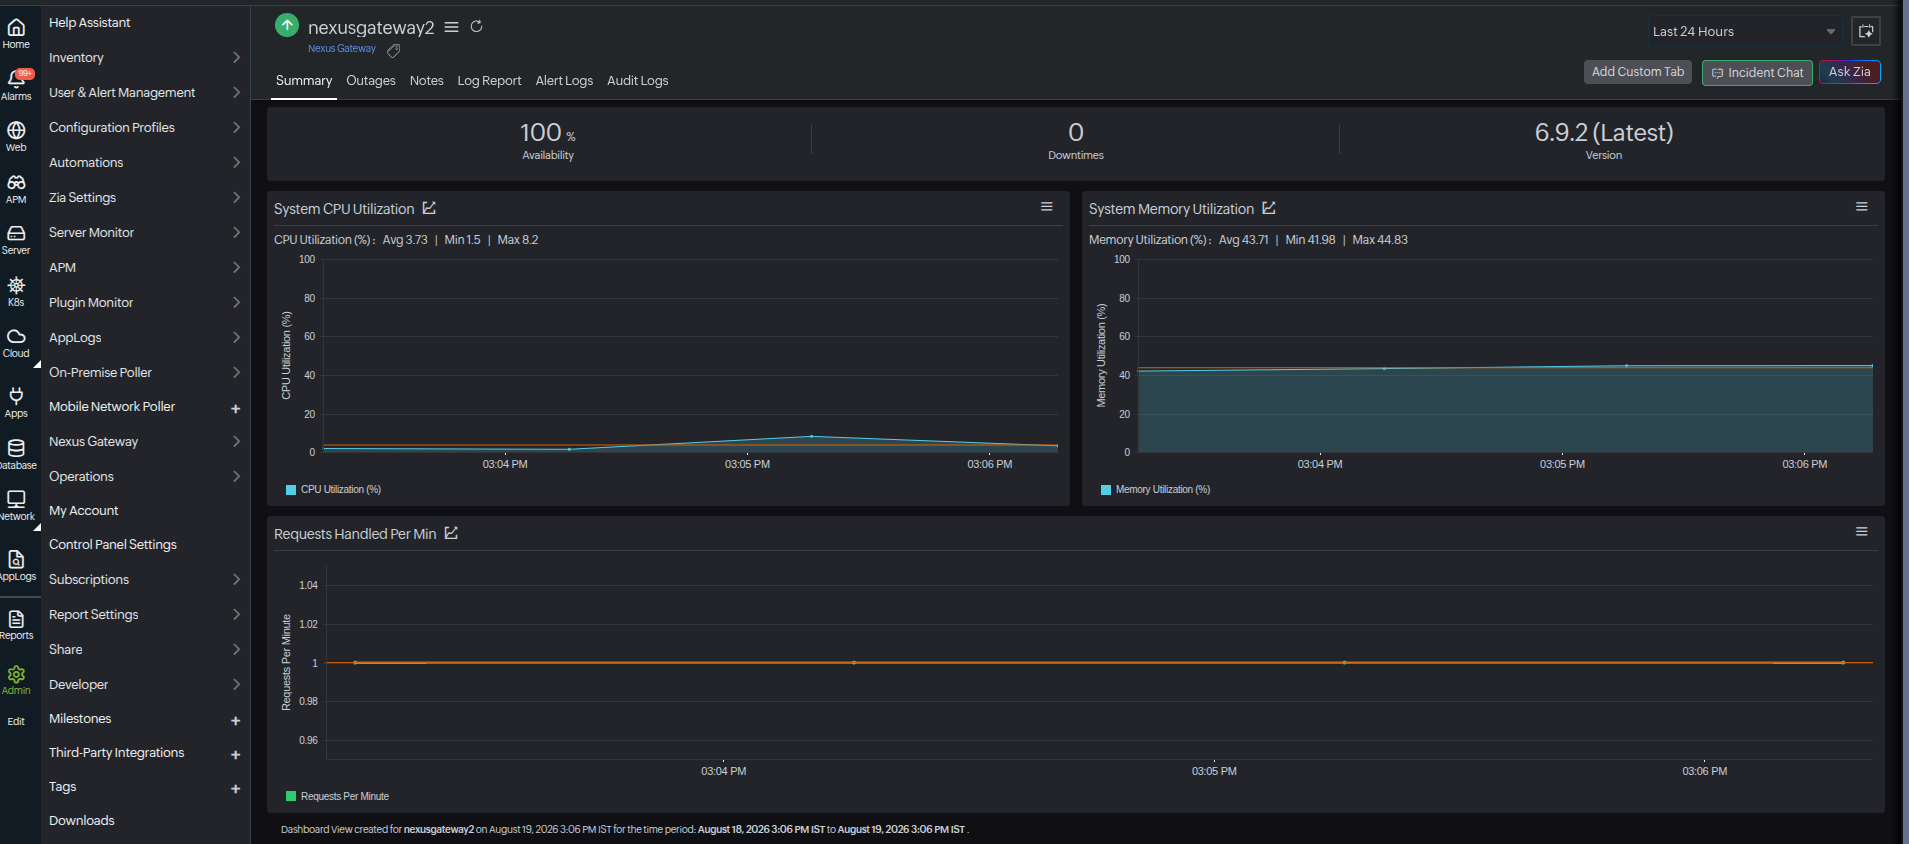
Summary
| Metrics | Description | Units |
|---|---|---|
| System CPU Utilization | Displays the graphical view of CPU usage over time. Identifies performance spikes and potential resource bottlenecks | Percentage |
| System Memory Utilization | Displays memory usage in real time. Identifies performance degradation and assists in monitoring memory workloads | Percentage |
| Requests per Minute Handled | Displays the number of requests processed each minute. Helps to identify traffic patterns and server workloads | Count |
Performance metrics of Nexus Gateway Group
Nexus Gateway Group's performance metrics provide insights into the operational efficiency, availability, and workload distribution of all Nexus Gateways within a group. These metrics help administrators monitor the health and performance of the Nexus Gateway infrastructure, identify potential bottlenecks, and ensure optimal communication between the Site24x7 agents and the Site24x7 cloud platform.
To access the added Nexus Gateway Group:
-
Navigate to Admin > Nexus Gateway Group > Nexus Gateway Group.
-
Choose the Nexus Gateway Group name to view the metrics.
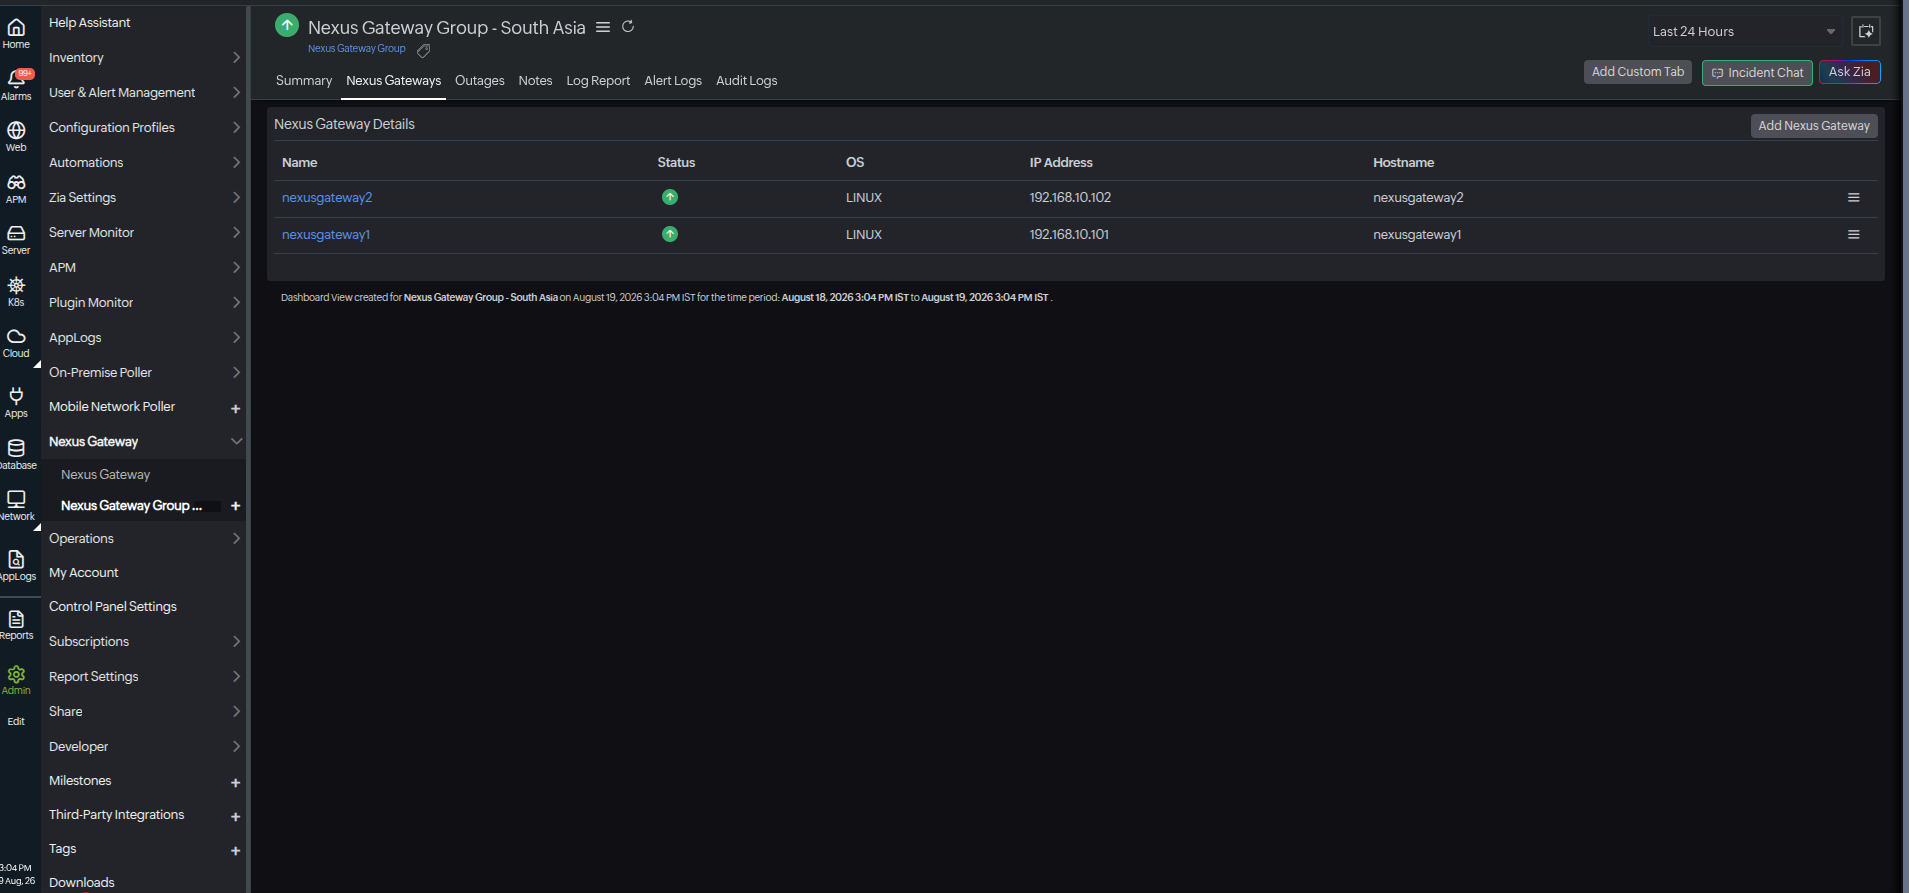
Summary
| Metrics | Description | Units |
|---|---|---|
| System CPU Utilization by Nexus Gateway | Displays the graphical view of CPU usage over time. Identifies performance spikes and potential resource bottlenecks | Percentage |
| System Memory Utilization by Nexus Gateway | Displays memory usage in real time. Identifies performance degradation and assists in monitoring memory workloads | Percentage |
| Requests per Minute Handled by the Nexus Gateway | Displays the number of requests processed each minute. Helps to identify traffic patterns and server workloads | Count |
Nexus Gateway details
| Metrics | Description |
|---|---|
| Nexus Gateway | Displays the name of the active Nexus Gateway(s) |
| Status | Displays the status of the Nexus Gateway (Up, Down, Critical) |
| CPU (%) | Displays the current CPU utilization as a percentage |
| Memory (%) | Displays the current memory utilization as a percentage |
| Requests per Minute | Displays the number of requests handled per minute by the Nexus Gateway |
Nexus Gateways
Nexus Gateways Details
| Metrics | Description |
|---|---|
| Name | Displays the name of the active Nexus Gateway(s) |
| Status | Displays the status of the Nexus Gateway (Up, Down, Critical) |
| OS | Displays the associated operating system |
| IP Address | Displays the IP address of the associated Nexus Gateway |
| Hostname | Displays the name of the host assigned with the Nexus Gateway |