Alert Logs
Gain a comprehensive overview of all alerts generated by Site24x7 using the Alert Logs. Easily track key details such as the monitored resource name, alert trigger time, root cause, and notification status. With the enhanced view, you can filter the alert logs by monitor type, outages, alarms, and so on. Toggle the New view to access enhanced filtering, customizable layouts, and deeper visibility into your alert data.

Use cases
- Identify misconfigurations
- A user receiving an unexpected alert can track misconfigurations in profile with alert logs.
- A user receiving alerts that do not align with the expected threshold configurations can trace misconfigurations in other profiles through alert logs.
- Track delivery status
- The logged delivery status and medium of alerts can be tracked with alert logs.
- Audit
- Verify compliance and incident responses during auditing with exported alert logs.
- Debug
- Optimize debugging of outages with insights from alert logs.
Accessing alert logs
To access alert logs, follow these steps:
- Log in to Site24x7.
- While troubleshooting outages, monitoring alarms, or reviewing device-level details, you can quickly access relevant alert logs without navigating away by gaining quick access to alert logs:
- Alarms
- In the left navigation menu, click Alarms.
- Click any of the alarms and navigate to the Alert Logs tab.
- Outages
- Navigate to Home > Outages.
- Click the Hamburger
 icon and select Alert Logs.
Access alert logs from the Outages tab in any of the Monitor, Monitor Groups, or Alarm details pages.
- Alert Logs
- You can navigate to Alert Logs directly in two different ways from the left navigation menu:
- Navigate to Home > Alert Logs.
- Navigate to Admin > Operations > Alert Logs.
- Subscriptions
- Navigate to Admin > Subscription > License Usage Summary > View Credit Usage.
The Credit Usage link is visible only for old plan users.
Monitors - Navigate to Home > Monitors > click on any one of the monitors > click Alert Logs tab.
- Navigate to Admin > Subscription > License Usage Summary > View Credit Usage.
- Monitor Groups
- Navigate to Home > Monitor Groups > click any one of the monitor groups > navigate to Alert Logs tab.
- Alarms
Understanding alert logs
To navigate through a large volume of data and view specific alert log details, apply a query-based filter. Once you enter the query you want, the appropriate alert logs are displayed.

There are three sections on this page:
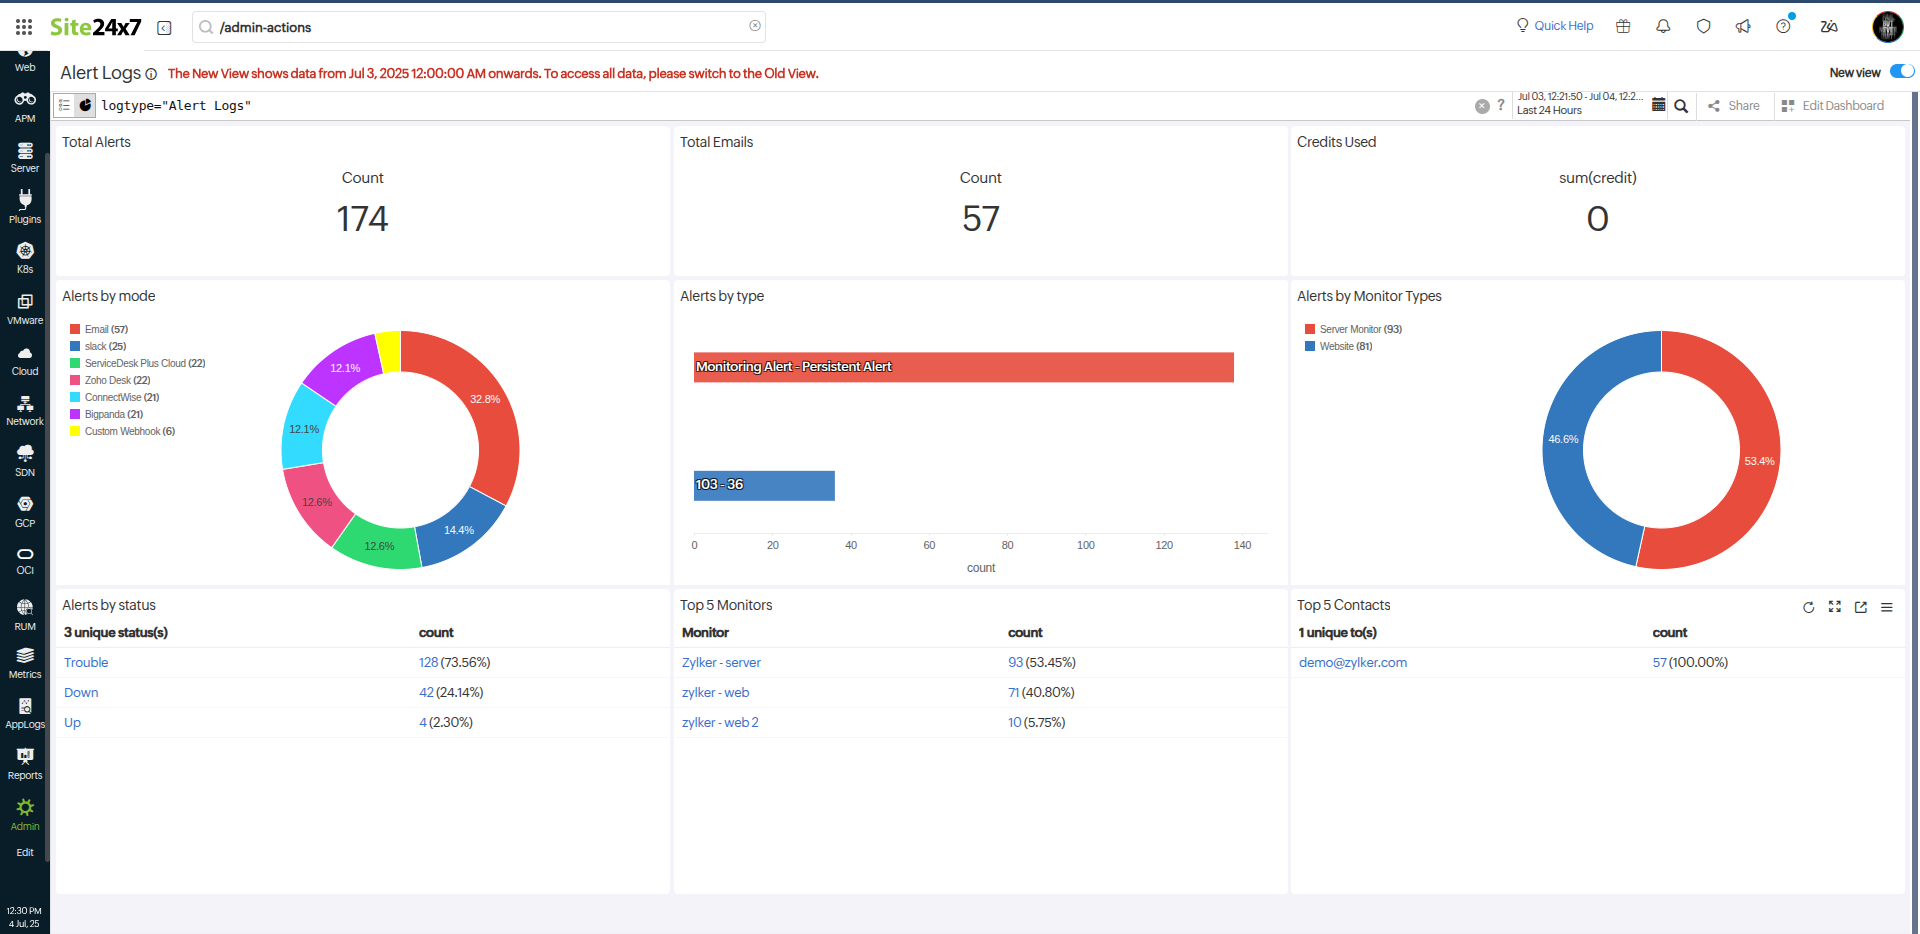
Query section
You can perform the following actions using the icons in the query section:
- Switch between the Alert Logs page and a dashboard view of the alert logs using the Dashboard
 icon.
icon. - View previously saved alert log search queries using
 icon. You can reuse the queries from the drop-down menu.
 - Click the Question Mark
 icon to learn how to generate queries.
 - Share the queried alert logs or view the history using the Star
 icon. You can email the alert logs as a PDF or download them as a PDF or CSV.
Log events
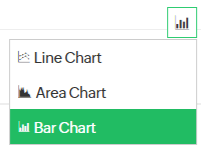
The log events are shown as charts, and the log details are displayed. Switch the view of log events between Line Chart, Area Chart, and Bar Chart using a drop-down menu that appears at the top right corner of the Log Events section.
Log details
Click the Customize Columns ![]() icon to select the columns like Status, Alert Type, Alert mode, Reason, and profiles like Threshold Profile, Notification Profile, On-Call Schedule, User Alert Group, and Alert Attribute Group.
icon to select the columns like Status, Alert Type, Alert mode, Reason, and profiles like Threshold Profile, Notification Profile, On-Call Schedule, User Alert Group, and Alert Attribute Group.
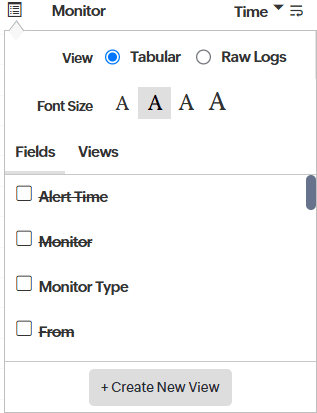
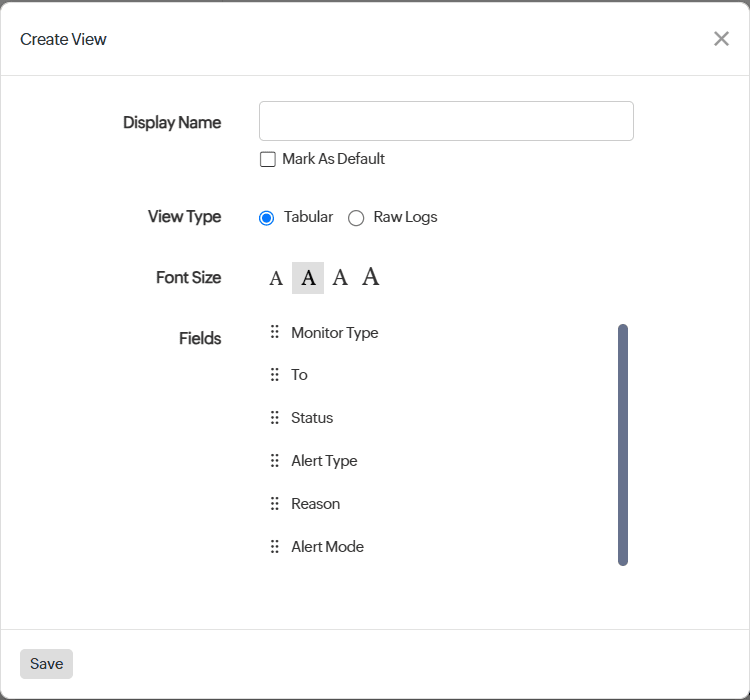
Here, you can switch between two views—Tabular and Raw Logs (logs in JSON format), and also select from four different Font Sizes. Click +Create New View to customize and set a default view for alert logs.
- Alert Time: Displays the time at which the alert was triggered.
- Monitor: Displays the monitor that triggered the alert.
- Monitor Type: Displays the monitor type of the monitor with alert.
- From: Displays the source from which the alert was triggered.
If the Communication mode is a Third-Party Integration, by default, the From column shows Site24x7.
- To: Displays the details of who received the alert as well as the Communication mode and Delivery Status. For Third-Party Integration, the configured integration profile name is shown.
- Status: Displays the status of the alert.
- Alert Type: Displays the type of alert like monitoring, escalation, persistent, or anomaly alert.
- Attributes: Displays the attribute that caused the alert.
- Reason: Displays the reason for the alert.
- Alert mode: Displays the channel through which the alert was communicated like email, SMS, or voice. If it is a third-party, then the service name of the third-party, like Jira, Stack, and Custom Webhook, is displayed.
- Monitor Groups: Displays the monitor group associated with the monitor during alert generation.
- Tags: Displays the tag associated with the monitor during alert generation.
The monitor group and tags shown align with the configuration during the alert generation, not the current setup.
- Threshold Profile: Displays the configured threshold profile.
- Notification Profile: Displays the configured notification profile.
- On-Call Schedule: Displays the details of the configured duty schedules to whom the alert was sent.
- User Alert Group: Displays the details of the configured user alert group to whom the alert was sent.
- Attribute Alert Group: Displays the details of the configured attribute alert group for which the alert was sent.
- Alarm Category: Displays the alarm type under which the alert can be classified.
Note- If the Threshold, Notification, On-call Schedule, User Alert, Attribute Alert, or Alarm name is changed in the configurations, it will be automatically mapped in the Alert Logs page.
- Alert Logs show the profiles that were associated with them when the alert was triggered.
- Credit: Displays the credit consumed by the alert notifications.
- Notification Provider: Lists the notification providers through which the alert notifications were sent.
- Outage: Displays the outage ID caused by the alert.
Click Save to view your customized Alert Logs page.
Alert logs show the delivery status of notifications, indicating whether a notification reached the recipient and why delivery failed.
Alert Logs - retention period
In Site24x7, the retention period for alert logs depends on the view and subscription plans.
- Alert logs in the new view are retained for 365 days.
NoteTo retrieve data older than 180 days, you should reindex. For reindexing assistance, please contact our support team.
- If you switch your subscription to a free plan, the alert logs from your previous paid plan are retained for 30 days. However, alerts are not logged while you are on the free plan.
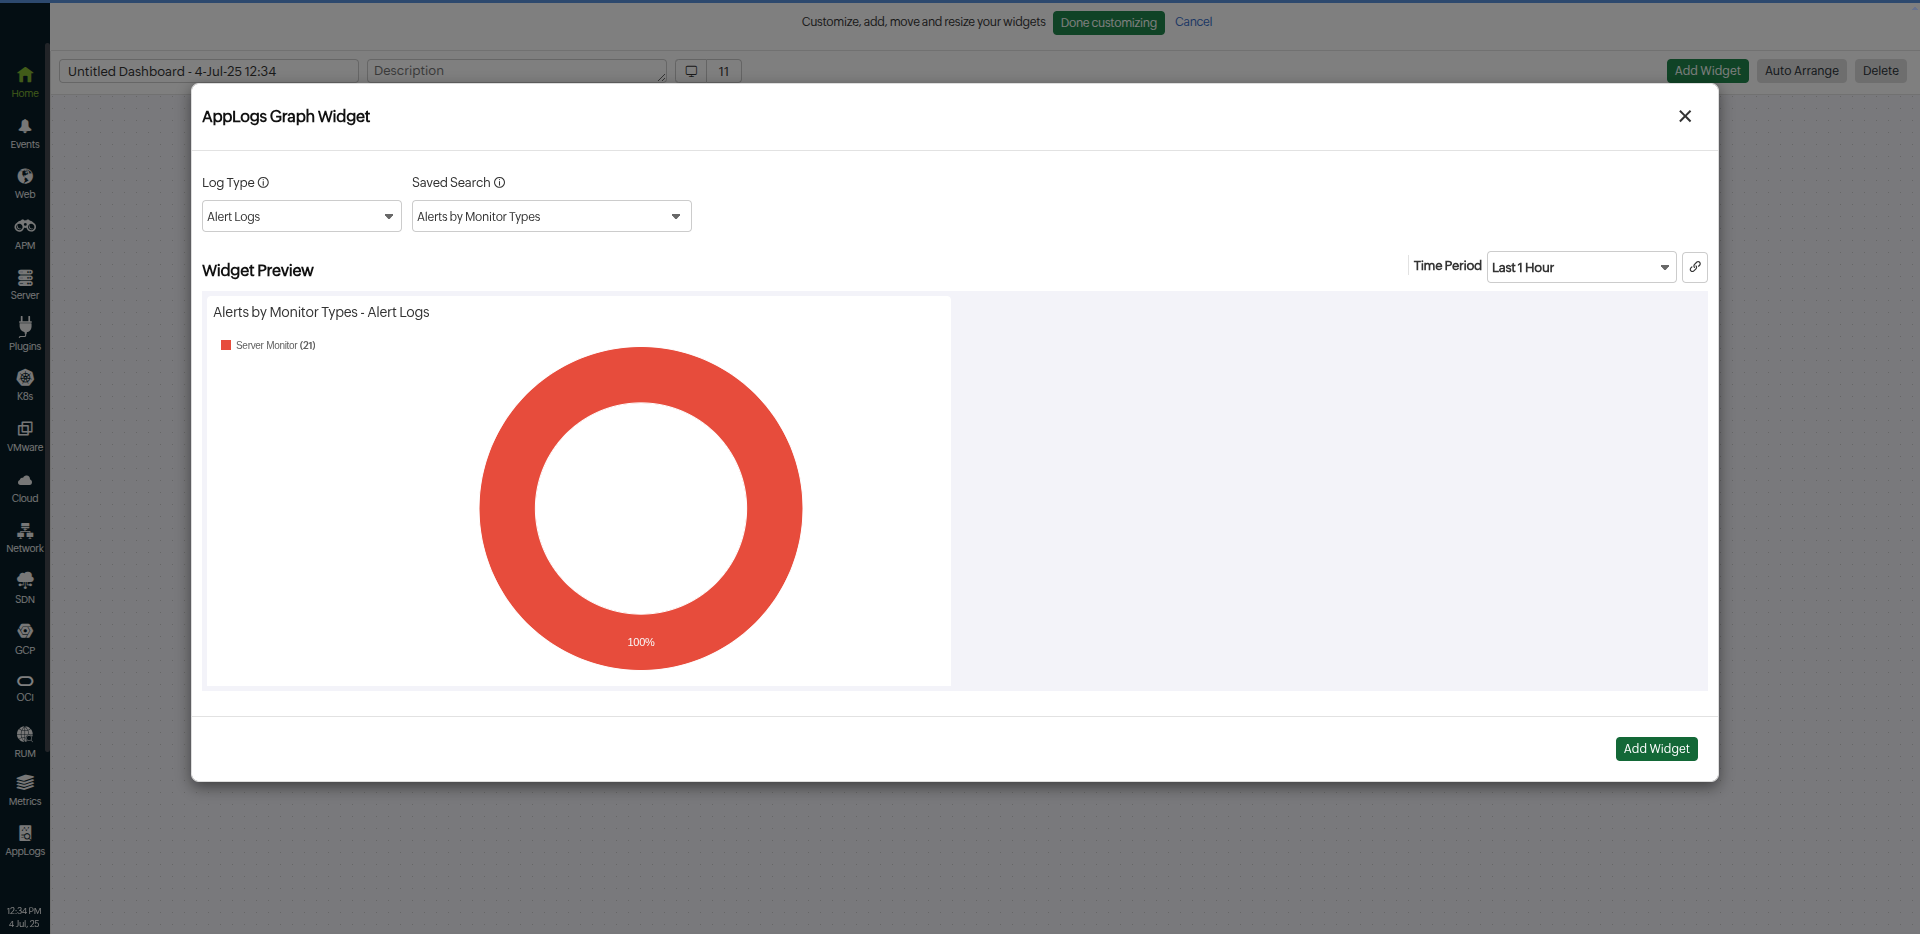
Creating alert logs-based widgets in dashboard
To view the alert logs for specific AppLogs directly from the dashboard follow the steps below:
- Save the query for which you want to create a dashboard widget.
- Navigate to Home > Dashboard.
- Open an existing dashboard and edit it or click Create new.
- From the Add Widget menu search for AppLogs.
- Select the widget you want to create.
- In the Add Widget pop-up, select log type as Alert Logs.
- Select the saved query from the Saved Search drop-down menu.
- Click the Add Widget button at the bottom right corner.